Pivotal Cloud Foundry (PCF) Developer Certification Study Guide – Metrics
PCF Developer Certification Review – Metrics
What is “PCF Metrics”?
PCF Metrics is a graphical tool provided by Pivotal Cloud Foundry that stores logs, metrics data, and event data from apps running on PCF for the past two weeks. It provides charts and graphics of the data to help operators and developers better understand the health and performance of their apps.
To access it, there are two ways:
Approach 1
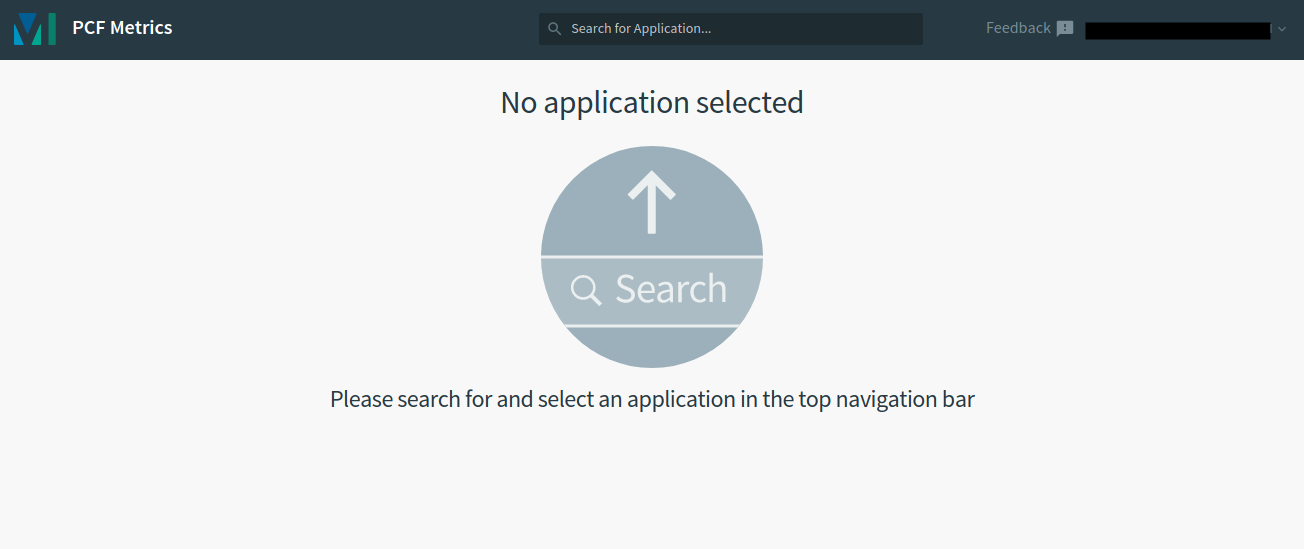
https://metrics.run.pivotal.io landing page
Go to https://metrics.run.pivotal.io/ and select application to open its metrics view, or
Approach 2
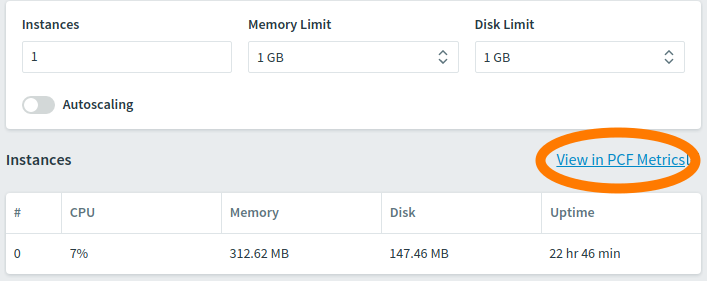
Link to PCF Metrics from Apps Overview on Apps Manager
Open PCF app Overview on PCF Apps Manager and click on “View in PCF Metrics” link.
What information does it provide?

PCF Metrics Charts
Container metrics:
- CPU usage
- Memory usage
- Disk usage
Network metrics:
- Requests
- HTTP errors
- Response times
App Events:
Update, Start, Stop, Crash, SSH, Staging failure
Logs:
Search, filter, and download App logs
Trace Explorer:
Traces of a request flows
Do you understand how to use the metrics to spot a badly performing application? For example: CPU or memory usage?
Container Metrics
| Observation | Possible cause(s) | Relieve(s) |
| Spike in CPU | a process that is computationally heavy | increase number of app instances |
| Spike in Memory | resource leak in the code | increase app memory |
| Spike in Disk | app is writing logs to files instead of STDOUT | set app to write logs to STDOUT |
| app is caching data to local disk | set app to use external caching services | |
| app is serializing huge sessions to disk | set app to store sessions to external services |
Network Metrics
| Observation | Possible cause(s) | Relieve(s) |
| Spike in response times | Users are waiting longer to use app | Scale app instances to spread the workload |
| Spike in HTTP errors | One or more 5xx errors occurred | Check logs for more info |
| Spike in HTTP requests | More users are using app | Scale app instances |